
Hey, Google, what’s the weather? We have become comfortable with the idea that we can make decisions based on accurate weather forecasts for the next three, five or seven days. Families plan cookouts for the upcoming weekend. Citrus farmers protect orange trees if a freeze is coming. Emergency managers evacuate towns that will be downwind of wildfires. Communities along rivers prepare sandbags to line homes and businesses if heavy rain looms.
But all kinds of decisions could benefit from accurate prediction that stretched as far as three or four weeks out. Farmers could determine how safe it is to plant crops in early spring by finding out whether a late-season frost is expected. Ski-resort operators could choose to wait to start making snow if temperatures were likely to warm again before they could set a base. Water managers could draw down reservoirs in anticipation of spring flooding—or store water if drought were expected. And, of course, you could plan for what your vacation might be like next month.
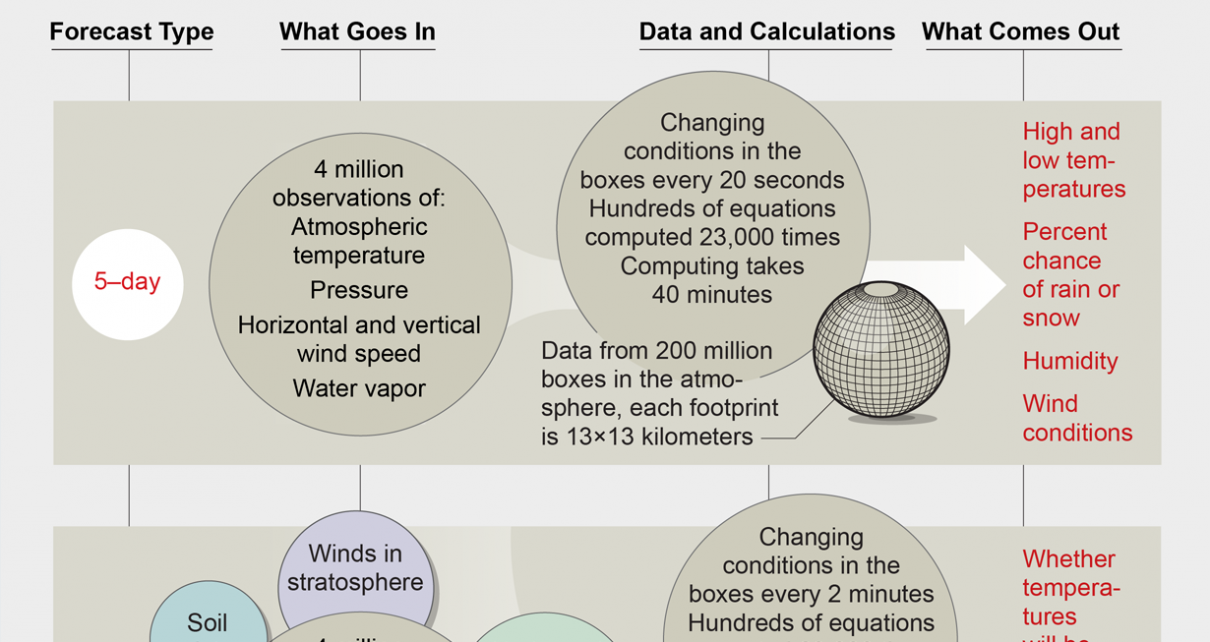
In the past several years atmospheric scientists have started to publish “subseasonal” weather forecasts that extend to three and four weeks. A typical seven- to 10-day outlook provides daily high and low temperatures, the percent chance of rain or snow, and wind conditions. A subseasonal projection predicts whether temperatures will be warmer or cooler than average for a given date, based on historical data, and whether it will be wetter or drier than normal. It also foretells hazardous and extreme weather. This time frame fills a big gap between short-term weather reports and seasonal forecasts that anticipate broad trends such as whether El Niño conditions in the Pacific Ocean will bring a warm summer to North America.
Subseasonal forecasts are improving. For example, a set of weather models known as SubX (the Subseasonal Experiment), led by me at George Mason University and one of my colleagues at the University of Miami, accurately predicted several weeks in advance the increased rainfall associated with Hurricane Michael in 2018, a bitterly cold air outbreak in the Midwestern U.S. in late January 2019, and the July 2019 heat wave in Alaska. The SubX project, begun three years ago, combines forecasts from seven major climate and earth research centers in the U.S. and Canada.
As an exercise for this article, on February 27 I used SubX to create forecast maps for the U.S. and for the world for March 21 through March 27—a time span 23 to 29 days out. The maps predicted warmer-than-normal temperatures in the Eastern U.S. and colder-than-normal temperatures in the West. They indicated that early spring conditions would prevail along the East Coast and that prolonged winter would persist in the West. The Southeast would continue to be wetter than usual, following a wet February. Several of the predictions were spot-on. A couple were not.
Global Weather Drivers
The seven- to 10-day weather projections we depend on are based on computer models that simulate how the atmosphere evolves. They contain mathematical equations that estimate how temperature, winds and moisture will change second by second and day to day. Since the birth of weather models in the 1950s, forecasts have steadily improved thanks to better scientific understanding of these variables and to advances in computing power. In 1990 only three-day forecasts were 80 percent accurate or better. Today the three-, five- and seven-day outlooks are at that level.
Many more factors must be considered in a week 3–4 forecast. Like a seven-day projection, this exercise begins with the current weather. Every day large national meteorological and space agencies around the world, including the National Oceanic and Atmospheric Administration and NASA, provide about four million observations of air temperature, atmospheric pressure, winds and humidity from weather balloons, weather stations, airplanes and satellites. Atmospheric scientists combine all these data in a weather model.
To stretch a seven-day forecast to three and four weeks, they incorporate other factors, including the temperatures and currents of the oceans. They analyze soil conditions: a few days of warm, dry weather can remove moisture from the soil, which subsequently provides less humidity through evaporation, further reducing precipitation and potentially starting a path toward drought. And they consider winds in the stratosphere, which extends from roughly 10 to 48 kilometers above Earth’s surface—higher than where airplanes fly. The winds influence the location and strength of the jet stream, which generally moves storms from west to east across the Northern Hemisphere and determines where extreme temperatures can occur.
The subseasonal models must also take into account certain global weather and climate phenomena. One of these is the Madden-Julian Oscillation (MJO), a large area of clouds, rain and wind that starts in the tropical Indian and Pacific Oceans and moves from west to east around the globe over several months. This event happens four to six times a year, sometimes in succession and sometimes at random. The MJO influences the winds, the locations of low and high atmospheric pressure centers, and where fronts arise in many regions. For example, it has a big impact on where rain falls in western North America in the form of atmospheric rivers—long, narrow bands of heavy rainfall that extend from the central Pacific Ocean to North America’s West Coast. Atmospheric rivers can cause devastating floods or can be a source of much needed water. The MJO can also increase wind shear in some places and decrease it in others, on a weekly basis, influencing where tropical cyclones form, which likely was a factor in the successful SubX prediction of Hurricane Michael.
The North Atlantic Oscillation (NAO) is another a factor. It is a persistent coupling of low and high atmospheric pressure in the northern Atlantic Ocean. It can affect the location of the jet stream, as well as the position of the polar vortex, which can drive extremely cold air in the Arctic down into the northeastern U.S. and Europe.
Massive Data Crunch
Calculating a subseasonal forecast requires so many operations using so many variables that the exercise taxes even the most powerful supercomputers. A model divides the three-dimensional atmosphere into many small computational boxes. For example, NOAA’s newest global weather model has about 200 million boxes. The boxes closest to Earth’s surface each cover a patch 13 kilometers long by 13 kilometers wide and are 50 meters high. Other boxes are stacked on top of them. As a stack progresses upward, the boxes get taller, reaching 700 meters in height in the stratosphere. The model predicts how the atmosphere will evolve in each box every 20 seconds, using equations that calculate temperature, pressure, horizontal and vertical wind speeds, and moisture.
Like the pixels of an image on your smartphone, when combined, the boxes can give a complete picture of the future weather. To make a five-day forecast, a model computes hundreds of equations about 23,000 times; this run, using all 1,500 computing cores on a large supercomputer, takes about 40 minutes.
Meteorologists must balance the highest possible resolution with a computing time that is quick enough to be useful. Even today’s five-day models do not capture certain factors in the boxes, such as individual clouds, thunderstorms and the effects of complex terrains such as mountains and coastlines. If the model’s resolution were tightened so that the box bases were six kilometers square—which is what would be needed to effectively represent those features—it would take more than five hours to produce a five-day forecast. Your local meteorologist cannot wait that long to provide timely information.
To create a workable model for four-week predictions that incorporates all the additional large-scale factors such as the MJO, we must make the boxes bigger, thereby reducing the number from 200 million to between two million and 10 million, depending on the model. Expanding the box widths to 50 or 100 kilometers allows us to perform the many complex calculations needed with the same computing power, also in about 40 minutes, but we lose detail. We can think of a week 3–4 forecast as the grainy pixels of a low-resolution image: We can still see the main features, but the fine points are not very clear. The large areas of warm temperatures and rain are like the outline of a person; the small features, such as a specific rainstorm, are difficult to identify.
Still, our understanding of global phenomena has improved enough, computing has gotten efficient enough and algorithms have become sophisticated enough that the models can now produce a low-resolution picture that meteorologists feel is respectable.
Models Teach Models
Every week the seven centers that contribute to SubX create their own predictions out to 32 to 45 days, incorporating several thousand more observations than they would include in a seven-day outlook. The groups send those data to a central database hosted by Columbia University’s International Research Institute for Climate and Society. SubX combines the data on computers at George Mason. The SubX team is the only one that integrates multiple models into a public forecast. About 10 other groups worldwide, such as the European Center for Medium-Range Weather Forecasts, produce subseasonal predictions based on single models.
SubX creates a temperature map indicating areas predicted to be warmer or colder than the historical average. It also produces a precipitation map showing whether areas will be wetter or drier than usual. Combining the seven models produces a much better outlook than any of the individual models, in part by averaging their data and in part by taking advantage of what each model does best. For example, every model has to estimate cloud conditions within each box, and they all do it slightly differently. Combining the models creates a best-case estimate. For U.S. forecasts, the SubX prediction is better than the best individual model 60 percent of the time for temperature and 81 percent of the time for precipitation.
Scientists at SubX are exploring ways to better combine the models, and we are also improving them by looking back in time. Over the course of a year, SubX ran numerous week 3–4 forecasts, starting with weekly weather conditions from 1999 to 2015, and produced a database with more than 20 terabytes of information. For each run, we compared the forecast with the actual weather that occurred three and four weeks later. This allowed us to test the effects of many different climate circumstances.
We are now using the accuracies and inaccuracies we identified to improve the models’ performance, including how well they can represent the stratosphere, the MJO and the NAO and predict the impacts of such phenomena on weather in various regions. For example, two of the NOAA modeling groups that supply data to SubX sharpened their equations for clouds, thunderstorms and rain to better characterize the MJO. They then reviewed the actual weather from the past and showed that the newly made historical week 3–4 forecasts were more accurate.
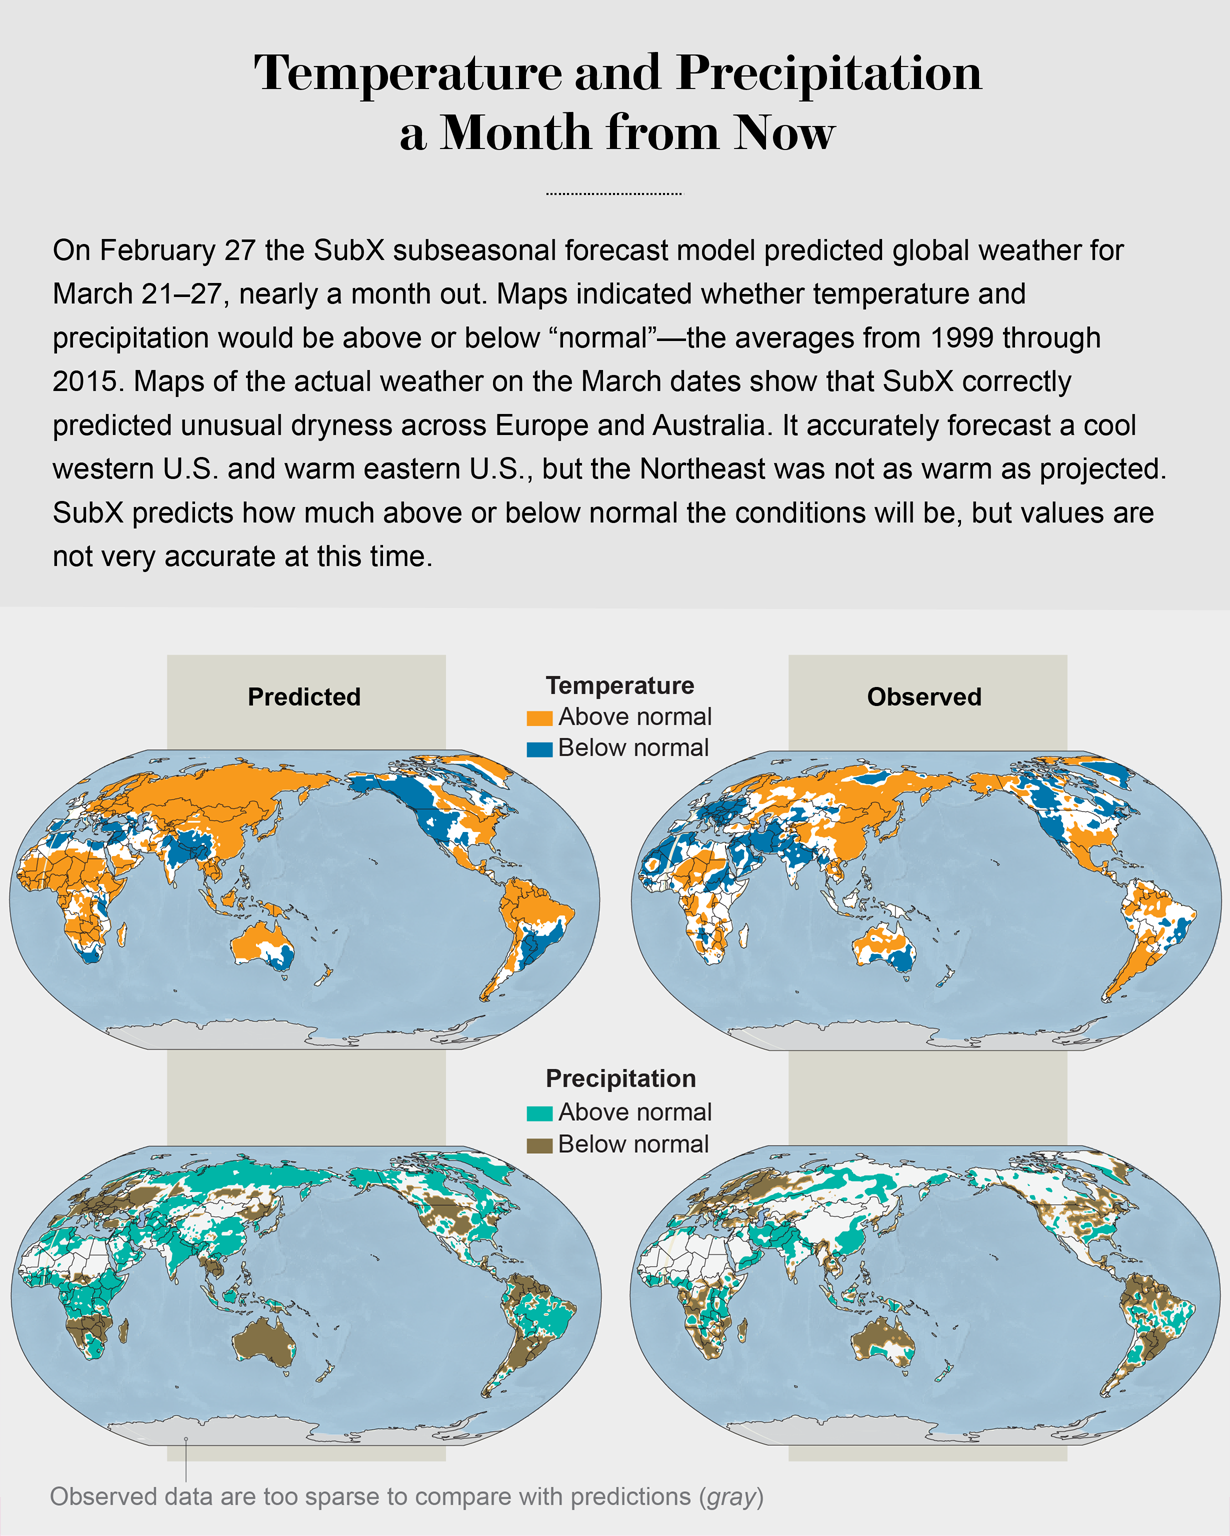
The Test: March 21–27
So how well did SubX do in its February 27 forecast for March 21 to March 27? The maps it created for the U.S. predicted warm temperatures in the East and cold in the West, along with early East Coast spring conditions and prolonged winter in the West. The Southeast was expected to be wetter than normal.
Unusually wet weather did continue in the Southeast. The predictions for rain in addition to spring snowmelt and an already high Mississippi River could have provided valuable information for flood preparedness in this region. Indeed, the Mississippi River at New Orleans was near flood stage on February 27, subsided a little after peaking on March 8, then rose in late March and early April, reaching flood stage again on April 12. SubX did well in part because it successfully predicted warm ocean temperatures in the Gulf of Mexico, a key condition for Southeastern rainfall. SubX also predicted the colder-than-normal conditions along the West Coast, as well as drier conditions in northern California and coastal British Columbia.
Globally, SubX successfully predicted drier-than-normal conditions over Europe and warmer-than-normal weather over Asia by correctly anticipating the locations of low- and high-pressure systems. The accurate temperature forecast for Australia was related to the model’s ability to predict the cloudy and sunny regions associated with the MJO.
SubX overestimated the geographic extent of warmer-than-usual weather in the U.S. mid-Atlantic, Northeast and Ohio River Valley regions. Some details of the high- and low-pressure systems were not correctly predicted, which hurt the forecasts. The model also failed to predict the wetter-than-average conditions in Oregon, although the heavy rain was relatively short-lived, occurring on March 24 and 25. Most of the seven individual models that make up the integrated SubX forecast, which we ran again the week before that rain, did not predict it either; the storm that produced the rain was a challenge even for seven-day prediction. Chaos can arise unexpectedly in the atmosphere.
We still have a ways to go before subseasonal projections are as accomplished as seven-day weather outlooks, and they might never be quite that good. But a large group of atmospheric scientists are hard at work trying to make it happen. Every week I publish a global four-week forecast from all seven of the models plus the combined SubX models. NOAA’s Climate Prediction Center in turn issues a week 3–4 outlook for the U.S. using guidance from SubX. Perhaps a decade from now, when you catch a glimpse of the weather forecast on your phone, you will see a sun or cloud icon in the corner above a label that says “28-Day Outlook.”