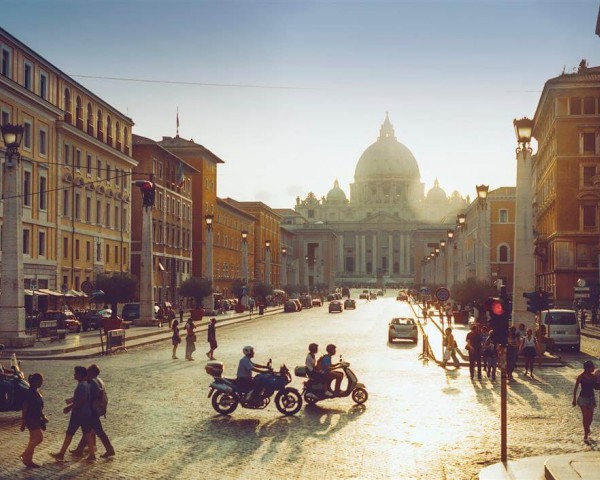
The Data Appeal Company presented a special report on the state of cultural tourism in Italy from which the strengths and weaknesses emerged, along with the potential of digitization.
Market data (based on Bank of Italy, ISTAT and other data) reveal a total expenditure of 16.1 billion euros in 2019 which decreased to 3.3 in 2021 and 115.2 million overnight stays against 23.9 million of 2021, with a decrease for both indicators of 79% for foreigners, while Italian presences suffered a contraction of -29%.
According to these statistics, the average daily expenditure of cultural tourists was 139 euros, while Italians settled on a lower average expenditure, which however marked a +6% in 2021 compared to 2019. Five main markets had 55 % of cultural attendance, both in 2019 and 2021.
70% of international flows concentrated on 1% of the Italian territory, a figure that would explain the problems of over-tourism and congestion of urban centers for the most visited art cities, to the detriment of all other destinations and villages, which remain highly residual in terms of attendance.
The Most Attractive Art Cities
Going into the detail of the report, it turns out that 70% of the 115.2 million overnight stays of foreigners on cultural tourism in Italian cities of art in 2019 were concentrated mainly in nine cities: Rome 28.3%, Venice 15.8%, Florence 10.7%, Milan 6.1%, Naples 4.5%, Palermo 1.7%, Verona 1.3%, Catania 1.3% and Pisa 1.2%.
The situation in 2021 was different and more dramatic: 23.9 million overnight stays of foreigners divided substantially between the usual well-known destinations; that is Rome 20.9%, Venice 16.9%, Florence 9.8%, Milan 7.3%, Naples 4.1%, Bari 3.0%, Verona 2.3%, Bologna 2.1%, Turin 1.6% and Pisa 1.3%.
In addition to the drop in attendance due to the Covid pandemic, the replacement of tourists from the USA and UK with visitors from European countries, especially Germany and France, emerged as well.
The top source markets in 2019 were USA 15%, Germany 12%, France 11%, the UK 10%, Canada 7%, Spain 6%, Australia 4%, the Netherlands 3%, Brazil 3%, and Japan 3%, recording 32% of visitors coming from long-haul, demonstrating that cultural tourism was the main reason for travel to Italy for international tourists.
Rome, but also Florence and Pisa, were among the cities of art that suffered the greatest decline in 2021 due to the strong link with tourism from Anglo-Saxon countries.
The Situation in 2022 and the Prospects for 2023
The second part of the report provided a preview of 2022 data and 2023 prospects through the use of 130 online sources including Google, Tripadvisor, and Online Travel Agency (OTA). e
The Data Appeal Company analyzed 73,000 points of interest, of which 6,000 attractors (museums, monuments, churches, squares, etc.) of the locations that fall within the offer of cities of art and cultural landscape. This means that a mass of 11 million digital data was taken into consideration, of which 1.4 concerned the attractors.
From all this work, a variation in content volumes of +36% for 2022 on 2021 emerged, only for accommodation it is a +75% of overnight tourism, testifying to the recovery that took place in 2022 on 2021. As regards the markets and types of travel, the return of long-haul travelers and the data on single travelers emerged, which represent 14%, and often do not find suitable offers.
The 2023 prospects show, based on digital content, an increase following that of 2022, so the estimates are that the cultural tourism sector will restore itself to pre-pandemic levels also thanks to the consolidation of the recovery of international tourism.
The Sentiment Index
The sentiment index emerging from the digital traces is of considerable importance for attractors and destinations. What can be deduced from the report is a very high (and increasing) rate for attractors, with an average of 91.9/100. The strengths are the atmosphere and beauty of spaces, exposure, and location. The reception and catering are not bad, but accessibility, costs and services are much less appreciated.
What goes wrong is the organizational part, a figure that indicates the various points of the offer to be improved, or rather the booking, management, website and waiting time systems. The most loved museums are Castel Sant’Angelo with a satisfaction rate of 94.6/100, the Uffizi Gallery 92.8, the Royal Palace of Caserta 92.3, the Accademia Galleries 91.4, the Museum of Turin cinema 90.9.
At the same time, the Colosseum in Rome, the Arena in Verona, Juliet’s House in Verona, the San Severo Chapel Museum in Naples, the Ferrari Museum in Modena and the Underground Naples Route also emerge in favor. As regards the cities of art, considering all sectors and not just the attractors, the average sentiment is 85.3/100. The LGBTQ+ index, which tells the level of inclusiveness of the offer, is just sufficient with a level of 60.44/100 for Italy, slightly better for cities of art and the cultural landscape with a 63.81/100 100.


